Cycling safety: What are the options to evaluate infrastructural measures in the best possible way?
More and more people use bikes to cover short and long distances. As exciting as this trend is, it poses new challenges for road safety experts.
SWOV, the Dutch Institute for Road Safety Research dedicated itself, especially to the topic of road safety for cyclists and implemented and evaluate design changes to two intersections in The Hague, Netherlands. The institute sought for a way to objectively measure road safety benefits for cyclists, to see what improvements the design changes have brought.
Read further to understand how TrafxSAFE™, Transoft Solutions™’s automated video analytics for road safety, provided detailed data about road users, their behaviours, conflicts and how these results could effectively answer their questions.
1 project – 2 intersections – 3 main infrastructural change elements
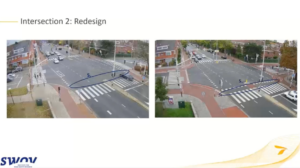
The project took place in the city of The Hague, the Netherlands, where two intersections were redesigned to improve road safety for cyclists in particular. Among all infrastructural scenarios the focus was set on the following three:
(1) moving the stop line for cyclists closer to the intersection,
(2) moving crossing cyclists further away from the intersection, and
(3) removing a mid-intersection left-turn box for cyclists, providing them with two-phase protected left turn options.
The methodology included collecting video data before and after the redesign for a total of 40 hours. Different video analysis tools and companies were considered to assess a sample video in order to identify the one most suitable for the project. TrafxSAFE was chosen for the road safety analytics as it was able to provide more comprehensive analyses and offered a reporting platform.
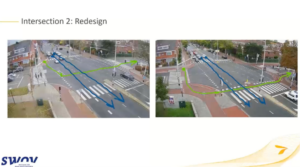
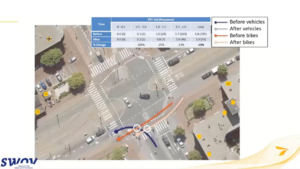
Vehicles and cyclist volumes, trajectories, number and severity of traffic conflicts, as well as vehicle speeds were calculated as a result of the video processing. SWOV was pleased to see that TrafxSAFE performed well in detecting and classifying various road users. How the technology visualized trajectories, conflict points and speeds (using heatmaps) and traffic volume counts was found to be equally practical and helpful.
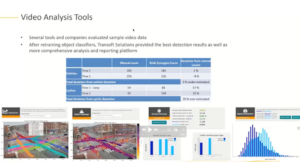
“After retraining object classifiers, Transoft Solutions provided the best detection results as well as the more comprehensive analysis and reporting platform.”
Dr. Matin Nabavi Niaki, Researcher, SWOV.
Getting a deeper understanding of road safety issues using video-based analytics
Depending on the country, there are many different approaches to making roads safer. Transoft Solutions is a global developer of innovative and highly specialized software for aviation, civil infrastructure and transportation professionals, operating in over 130 countries. The Transportation Safety Business Unit provides a number of automated video-based road safety solutions which have been assisting practitioners to design and evaluate any type of infrastructure worldwide.
What is the approach, the maxim behind the software?
It is the idea of foreseeing crashes before they happen. It is about proactive approaches to identify crash factors in advance and to be able to evaluate measures without having to wait for historical collision data.
Currently there are three main video-analytic tools available in our portfolio:
• TrafxFLOW™ provides traffic flow data, such as road user speeds and counts, but no conflict analysis
• TrafxSAFE™ (Plus) offers video-based road safety analytics for pre-recorded material (~ 60 hours). Ideal for conducting network screenings, determining safety risks or conducting before and after studies.
• TrafxSAFE™ Connect, a system suited for long-term monitoring, leveraging existing fixed camera networks, suitable for smart cities
CRASH DATA SHOWS ONLY A TINY FRACTION OF ALL DANGEROUS ROAD INTERACTIONS
Most often historical collision data is used as a basis for decision-making, as the main source of road safety information, including incidents and their severity. But – analogous to an iceberg – this is only the peak! We must not forget analysing near-miss events, traffic conflicts, and other dangerous behaviour effectively leading into collisions.
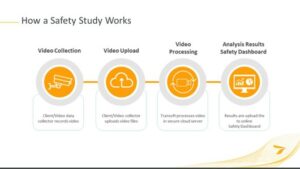
How does it work?
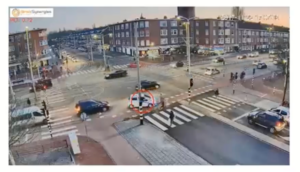
1. COLLECTING VIDEO MATERIAL
All that is needed for analysis is the corresponding video material, which can be collected either by the client or a local data collector (often recommended by Transoft Solutions).
2. UPLOADING AND PROCESSING
Once available, the video material is uploaded to Transoft’s online platform, where it is processed after a quick calibration.
3. ACCESSING & DOWNLOADING THE RESULTS VIA THE ONLINE SAFETY DASHBOARD
All results are uploaded online to the Safety Dashboard, which offers views to explore traffic and safety data. As for near misses and speeding: the platform organises 10-second video clips in playlists, holding high value when assessing the risk. Furthermore, heatmaps are prepared as an overview for the spatial distribution of road user speed and conflict data.
EVALUATING THE EFFECTS OF THE REDESIGN THANKS TO TRAFXSAFE
The results of the video analysis from the study clearly showed how the behaviour of the cyclists changed. As cyclists started to use the new infrastructure, drivers had a better view of them when interacting. All in all, it was evaluated that the redesign resulted in an overall risk improvement ranging from 13 to 92%.
One of the main advantages of using this method is that this is a more ethical, more proactive approach. There is no need to wait for crashes to happen and just a few hours of video data provides enough information to evaluate road safety.
The technology can equally be used at an any intersection redesign projects to identify problematic areas to focus on improving.
Video-based analytics holds great potential for road safety work. Thanks to proactive measurements, infrastructure systems can be assessed and any drawbacks identified can be remedied before collisions happen. Newly implemented measures can also be checked and confirmed quickly. Should a redesign project not be effective enough based on the video observation, subsequent improvements can be implemented more efficiently.
Cycling safety: What are the options to evaluate infrastructural measures in the best possible way?
Questions & Answers
Automated video analytics is a highly effective tool for traffic planners and road safety experts. The study in The Hague impressively showed how newly implemented countermeasures can be evaluated.
Dr Matin Nabavi Niaki, researched at SWOV, the Dutch Institute for Road Safety Research and Julie Levy, B.Eng., Project Delivery Manager at Transoft Solutions, deeply involved in the project, answered questions after the webinar.
#Q1: What was the hardest part in the redesign?
Dr Matin Nabavi Niaki: It was the redesign itself, maybe not the most difficult but results could have been even better if the study had been done beforehand. It might also have saved costs by focusing on specific areas to improve instead of improving everything that they could at the intersections.
#Q2: Were there any changes made to the programming of the traffic lights / signal phasing?
Dr Matin Nabavi Niaki: Yes. Changes were made as there was no dedicated green phase for cyclists, which was implemented in the course of the redesign.
Also, in the first intersection a dedicated left turning green phase for vehicles was installed as in the before scenario there were some conflicting vehicle – vehicle interactions observed. After this change all left-turn conflicts were eliminated.
#Q3: Can you say more about the data which the software provides? How are risks calculated and which risk factors are taken into account?
Julie Levy, B.Eng: When talking about risk we face two components: the probability and the severity of a collision. For collision probability, we use PET (post encroachment time) collision indicator, as the main metric. This is defined as the amount of time between the moment when the first road user and the second road user arrive to the same conflict point. The smaller the number is, the more probable a collision. For this project we only used PET. In the meantime, we are also able to compute another collision indicator, which is TTC (time to collision).
The other component is the severity, if a collision were to happen. This factor includes the speed and type of road users as well as further information, such as which road user arrived first to the conflict point. All this information is provided online with the additional possibility to download it as a CSV file.
For each conflict an approximate severity can be determined.
The practical handling of a project using our software is very simple. You send us the video first, or you upload it onto our platform. Then the calibration of the video is started by Transoft and the video is processed. At the end, results are published to our comprehensive online Safety Dashboard.
TrafxSAFE is an excellent tool to implement an efficient and proactive Road Safety Management Process. It helps practitioners to get a deeper understanding of traffic patterns and road user behaviours associated with crash risk, for faster identification, execution, and evaluation of countermeasures.
With the help of video analytics, the Dutch Institute for Road Safety Research was able to easily compare and evaluate the implemented design changes of two intersections in The Hague.
Please reach out to us directly for further insights! We’re happy to discuss how video analytics can help you gain more grip on your road safety challenges in a matter of weeks.